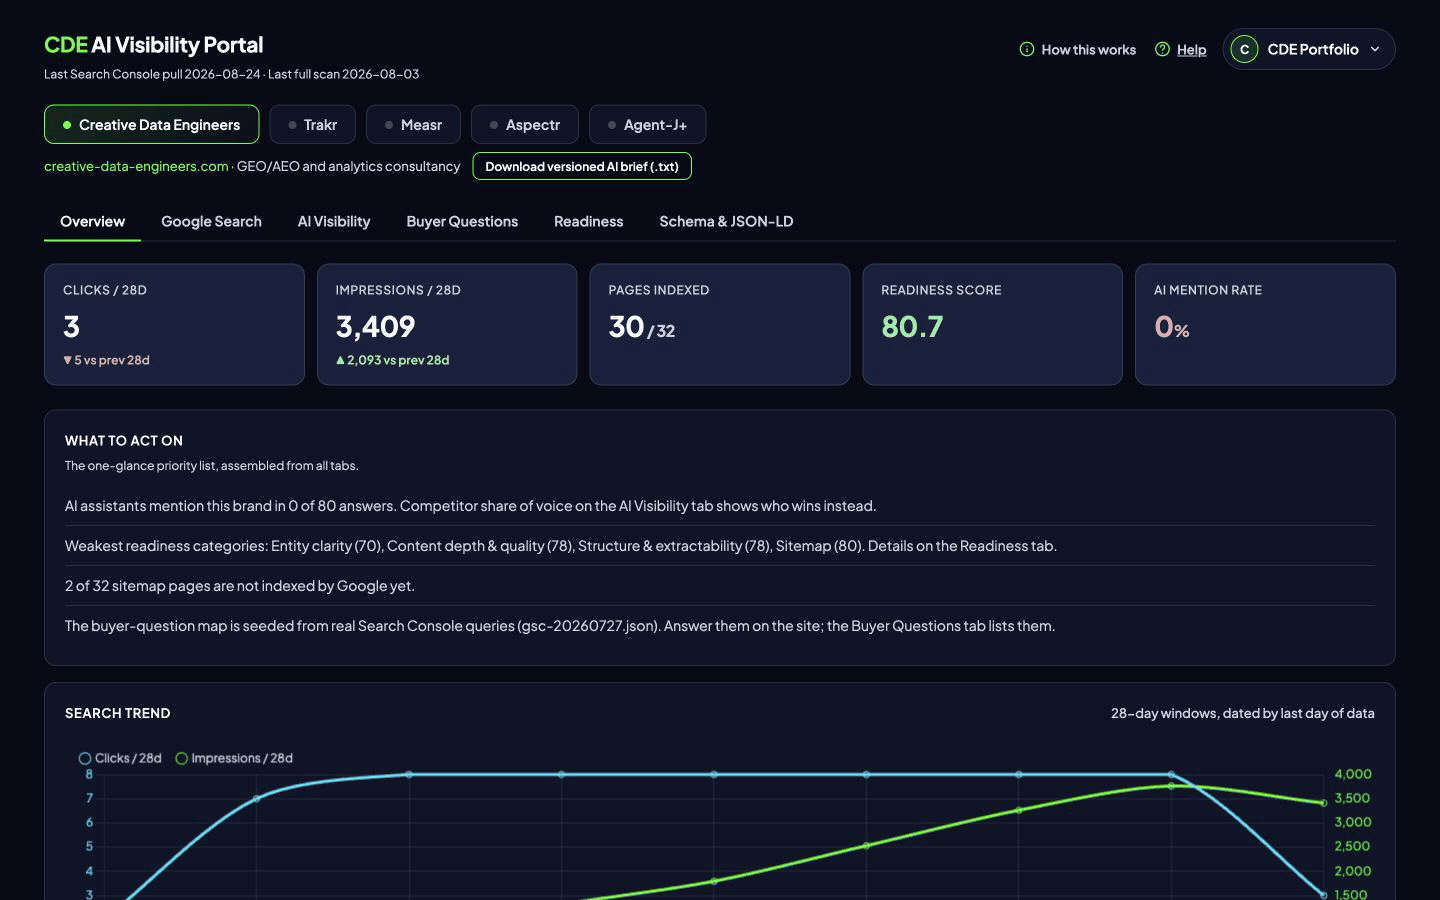
1. Overview
Overview brings the latest headline signals into one place. Use it to spot the areas that need attention, then open the related tab for the underlying questions, pages, or source details.
2. Google Search
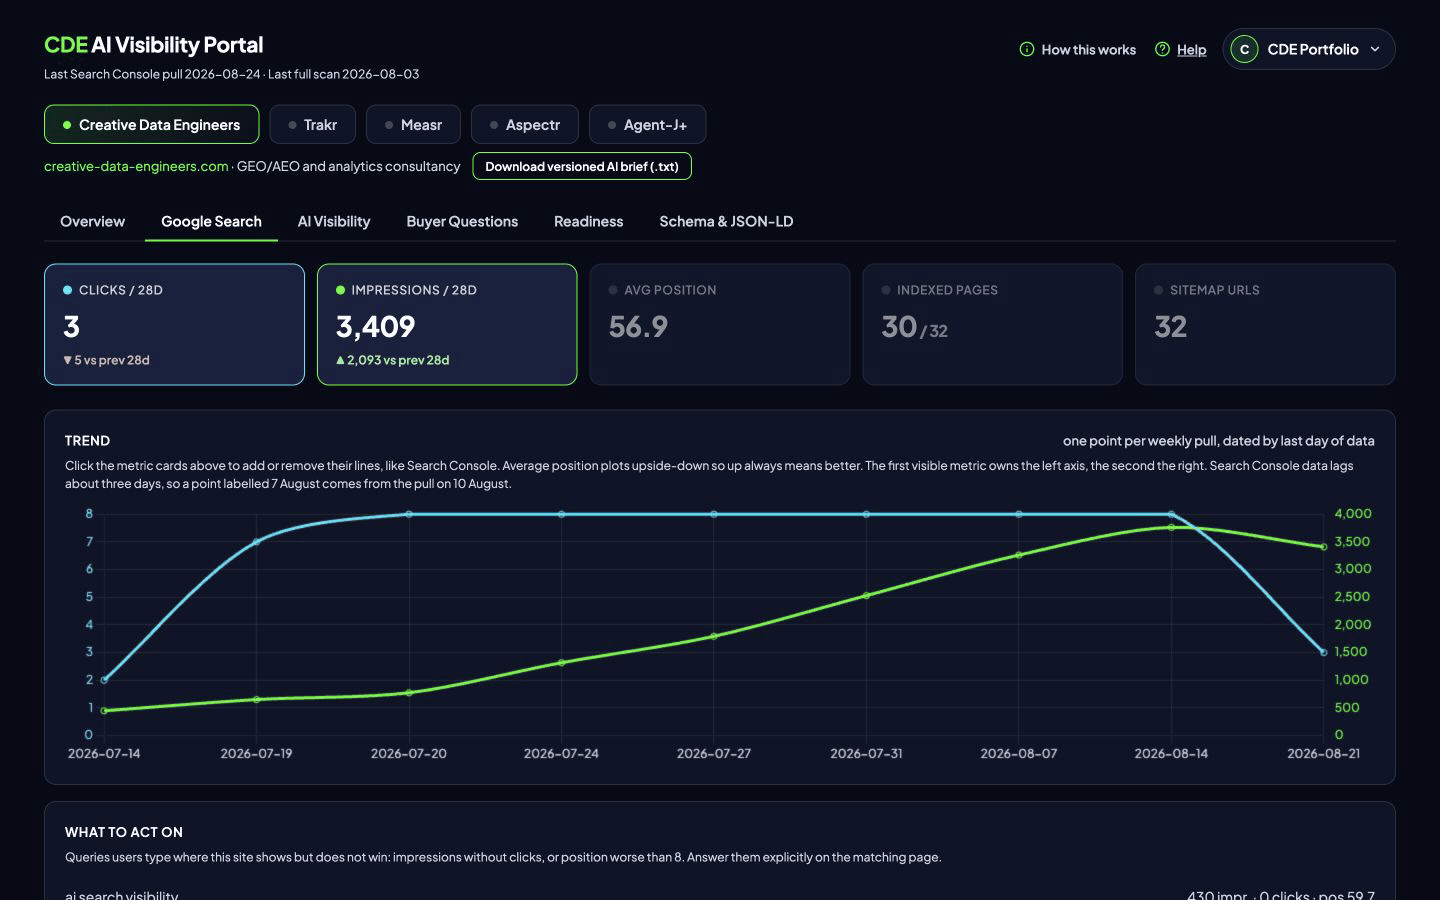
This tab reports observed organic demand from Google Search Console. It shows clicks, impressions, average position, and the queries that caused the site to appear in search.
Question-shaped queries help seed Buyer Questions. The date note explains the reporting window and the normal source lag.
3. AI Visibility
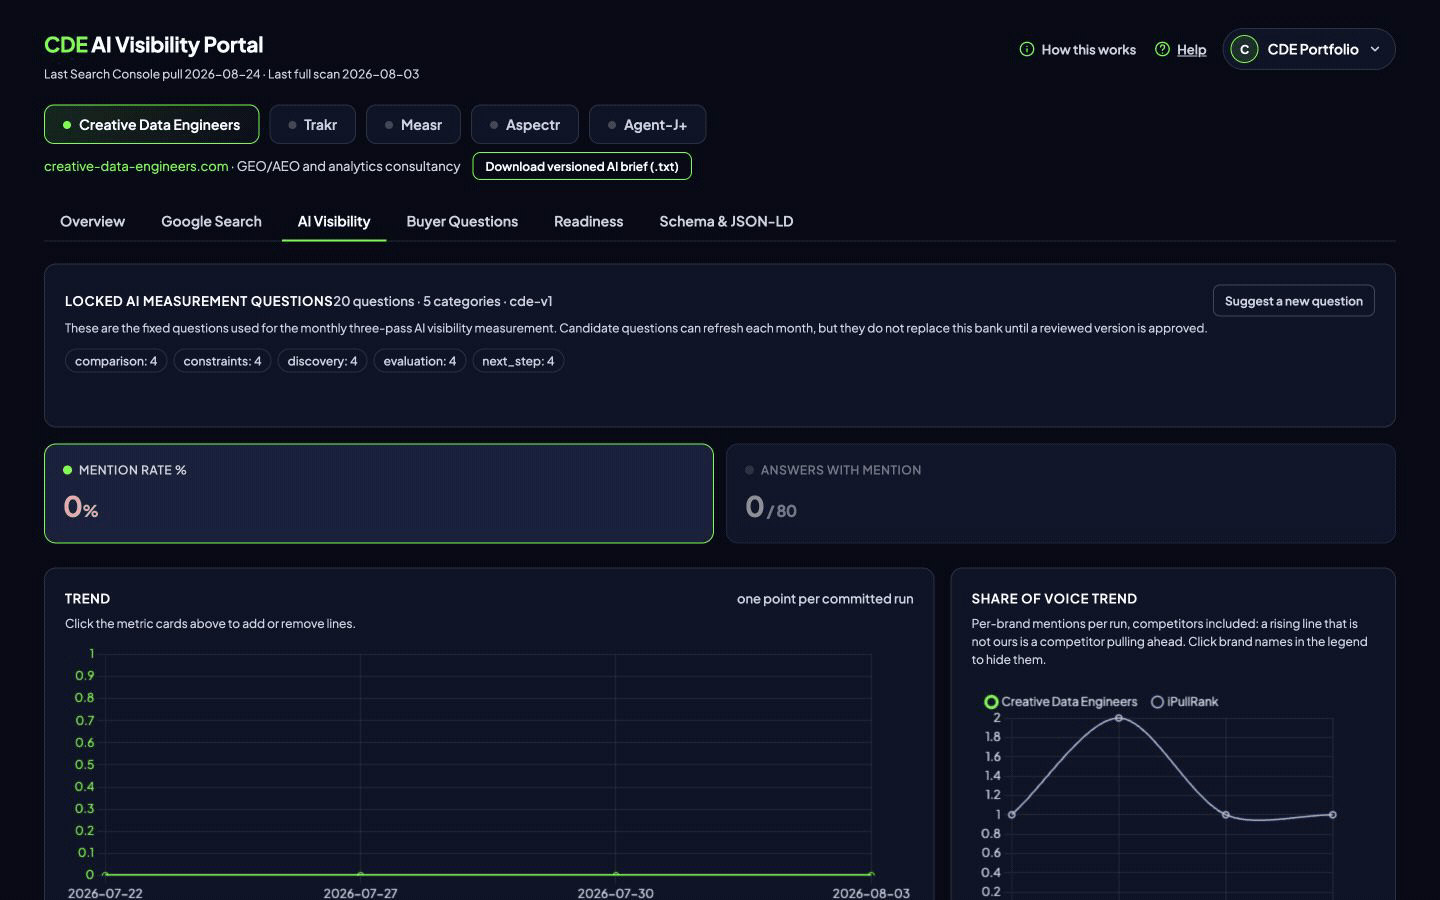
This tab shows how often monitored assistants mention the brand and cite a source when answering the locked buyer questions. It also shows per-question results and competitors named in the same answer space.
Use mention and citation together. A brand can appear in an answer without its website being used as a source.
4. Buyer Questions
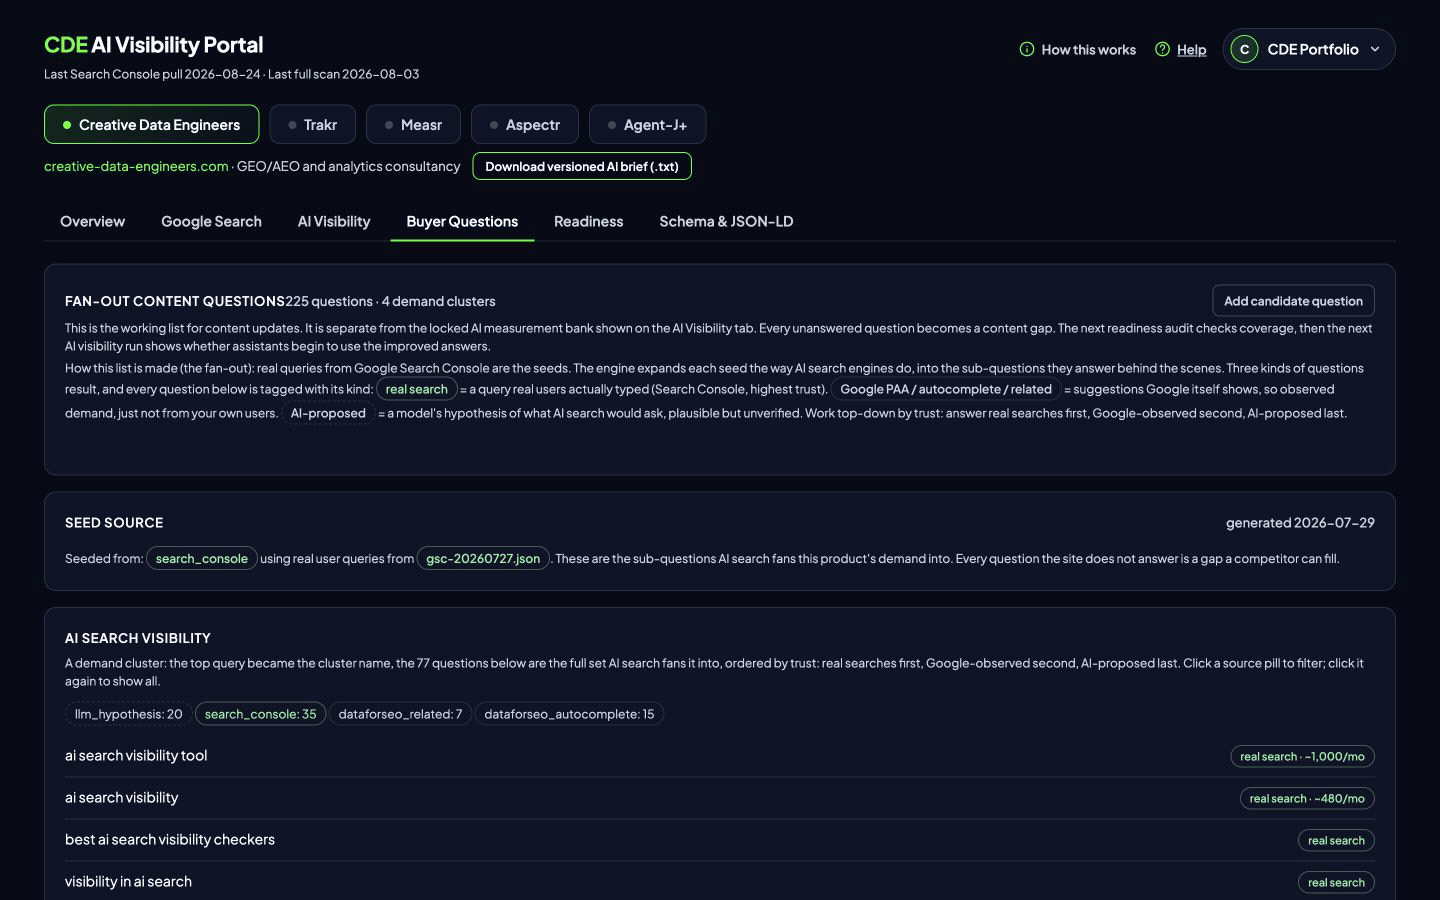
This is the wider fan-out map of questions people may ask while researching a purchase. Questions are grouped into demand clusters and carry source labels so observed demand stays distinct from clearly labeled hypotheses.
Open the question rows for detail. You can also propose a candidate question or suggest a change to a locked measurement question.
Preliminary preview
The label Preliminary: one of three scheduled samples identifies the verified Monday sample. After the next verified sample, the label changes to Preliminary: two of three scheduled samples. This second preview contains Monday and Wednesday. Friday is still outstanding.
The three-sample baseline becomes available after the scheduled Friday sample passes verification.
Before the baseline, the portal withholds deltas, trends, recommendations, and any measured or live status. Wait for the three-sample baseline before choosing actions from these measures.
When Search Console data is unavailable, the preview uses fallback evidence. Its confidence note names the hypothesis evidence and the resulting reduced confidence.
5. Readiness
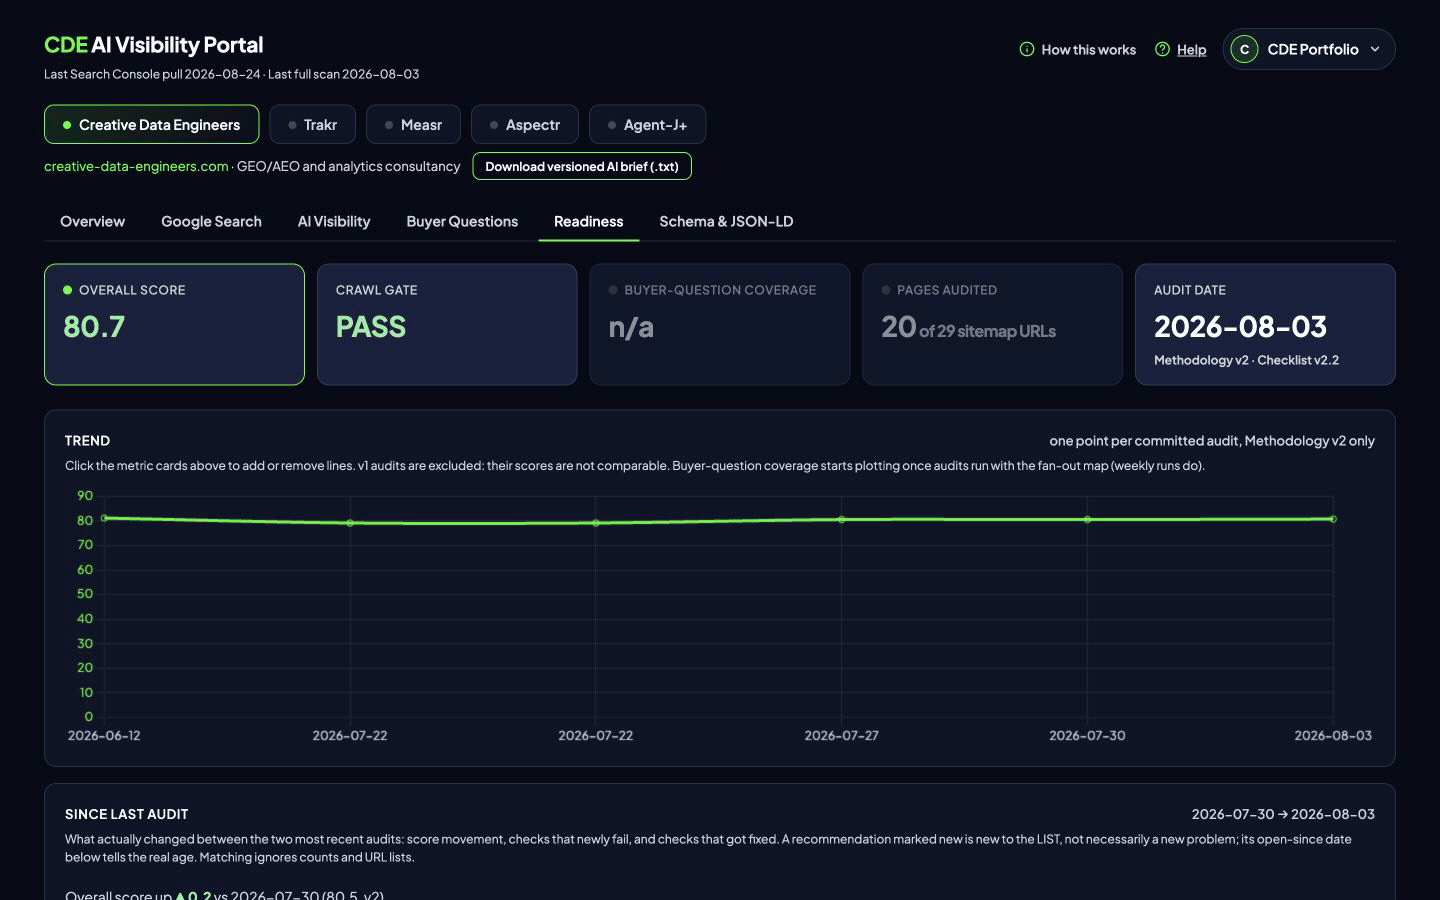
Readiness checks whether AI systems can fetch, understand, and quote the site. It combines a weighted Methodology v2 score with a separate per-engine crawlability gate.
The tab breaks the score into categories and page findings, then points to the issues that limit retrieval or clear extraction.
6. Schema & JSON-LD
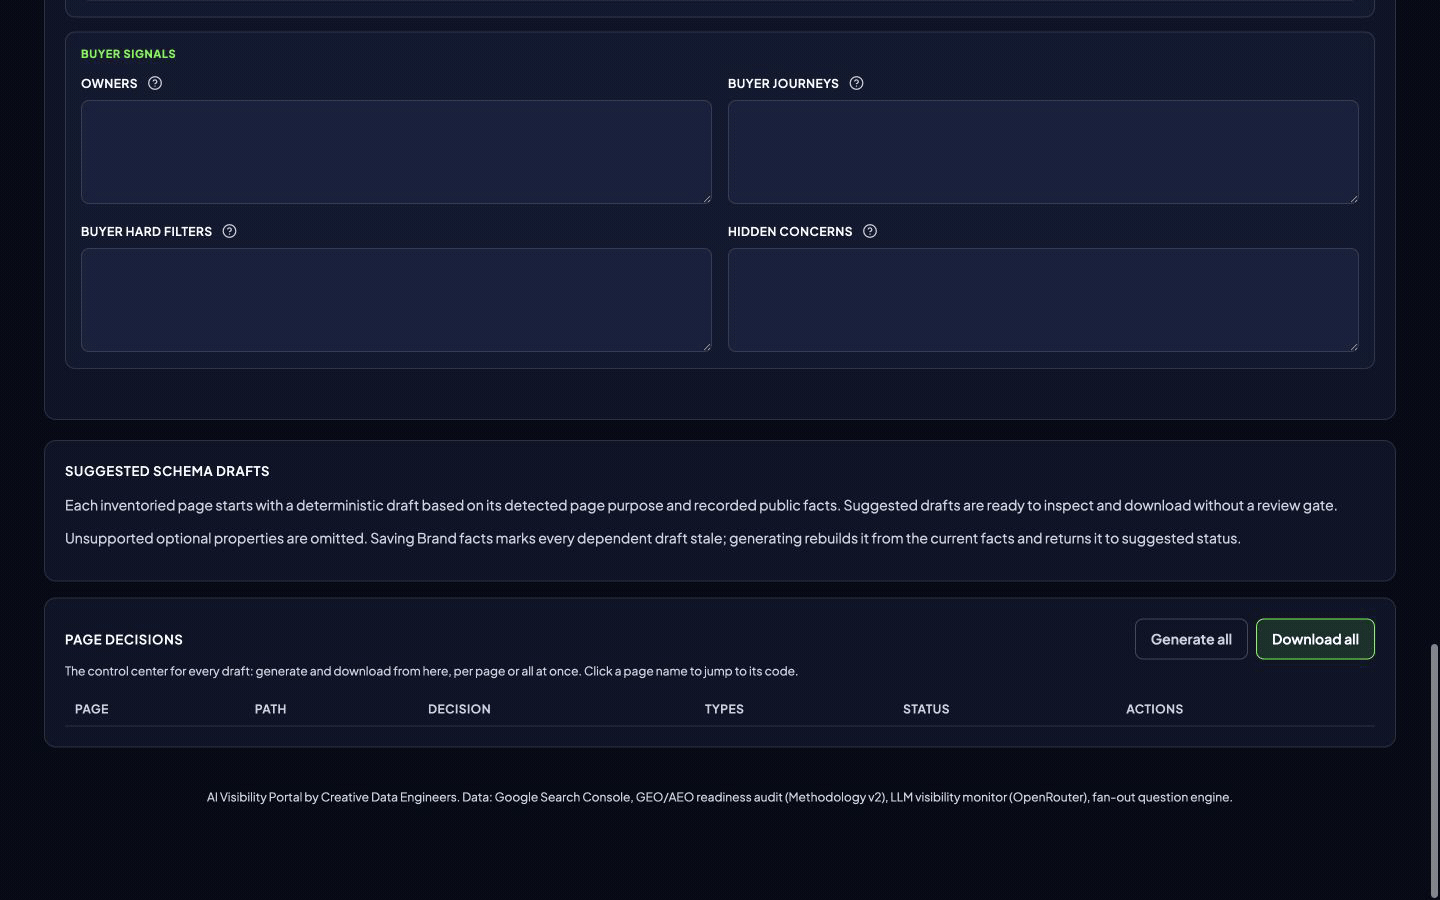
This tab contains the Measurement setup and editable Brand facts, followed by Suggested schema drafts. Page decisions show which draft belongs to each inventoried page and which Schema.org types it contains.
You can generate current drafts from confirmed facts and download one page or all pages. Current release documents, including the versioned AI brief when available, use the Download control near the selected brand information above the tabs.
KPI color bands
Colors are a quick reading aid. They do not replace the source date, methodology note, or detailed finding.
Green: 70 and above
The score is in the strongest portal band.
Blue: 50 to 69
The score is in the middle-high portal band.
Amber: 25 to 49
The score points to material room for improvement.
Red: below 25
The score is in the priority band.
Frequently asked questions
Where should I start?
Start with Overview, then open the tab behind any signal that needs more detail.
What does a green KPI mean?
Green applies to a score of 70 or higher.
Does a red KPI mean the data is invalid?
No. Red applies to a score below 25. Source dates and status notes tell you whether the data is current and complete.
Where are schema drafts?
Open Schema & JSON-LD to review page decisions and download drafts.